|
|
AERODYNAMICS |
|
|
AERODYNAMICS |
Aerodynamics is the branch of fluid mechanics that deals with the motion of air and other gaseous fluids, and with the forces acting on objects in motion relative to such fluids. Although in space flight we are usually dealing with vehicles traveling in the vacuum of space, there are phases in every mission, such as launch, when a vehicle must move through the atmosphere of Earth or another planet. During these phases a vehicle's motion is greatly influenced by aerodynamic forces.
Figure 3.1
|
Types of drag are generally divided into the following categories:
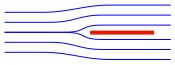
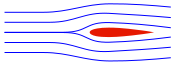
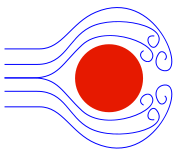
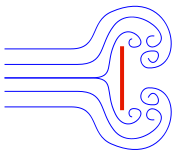
Form drag, or pressure drag, is caused by the air that is flowing over the body. The separation of air creates turbulence and results in pockets of low and high pressure that leaves a wake behind the body (thus the name pressure drag). This opposes forward motion and is a component of total drag. Since this drag is due to the shape, or form of the body, it is called form drag. Streamlining an aircraft, rocket or reentry vehicle will reduce form drag, and parts of a vehicle that do not lend themselves to streamlining are enclosed in covers called fairings that have a streamlined shape.
Skin friction drag is caused by the actual contact of the air particles against the surface of the body. This is the same as the friction between any two objects or substances. Because skin friction drag is an interaction between a solid and a gas, the magnitude of skin friction drag depends on the properties of both the solid and the gas. For the solid body, skin friction drag can be reduced by keeping a vehicle's surface highly polished and clean. For the gas, the magnitude of drag depends on the viscosity of the air. Along the solid surface of the body, a boundary layer of low energy flow is generated. The magnitude of the skin friction depends on the state of this flow.
Interference drag results when airflow around one part of a body (such as a fuselage) must occupy the same space as the airflow around another part (such as a wing). The two competing airflows must speed up in order to pass through the restricted area. This speeding up process requires extra energy and creates turbulence, resulting in a measurable increase in the form drag. This velocity increase is present at all airspeeds, but become even more important in the transonic range when the resulting velocity become sonic, producing shock waves.
Parasitic drag is simply the mathematical sum of form drag, skin friction, and interference drag. The phrase parasitic drag is mainly used when discussing lifting wings, since drag is generally small in comparison to lift. For flow around bluff bodies, drag usually dominates, thus the qualifier "parasitic" becomes meaningless. Form drag, skin friction drag, and interference drag on buff bodies are not considered elements of "parasitic drag", but directly as elements of drag.
Induced drag is the drag created by the vortices at the tip of an aircraft's wing. Induced drag is the drag due to lift. The high pressure underneath the wing causes the airflow at the tips of the wings to curl around from bottom to top in a circular motion. This results in a trailing vortex. Induced drag increases in direct proportion to increases in angle of attack. The circular motion creates a change in the angle of attack near the wing tip that causes an increase in drag. The greater the angle of attack up to the critical angle (where a stall takes place), the greater the amount of lift developed and the greater the induced drag.
Wave drag occurs in supersonic flight, or flight above the speed of sound. Wave drag is a form of pressure drag. When a vehicle breaks the speed of sound, a shock wave is created. A shock wave is a strong pressure wave that creates a violent change in pressure. High pressure pushes on the front of the vehicle. This results in a large pressure drag toward the rear of the vehicle like that produced with form or pressure drag in subsonic flight.
The amount of drag generated by an object depends on a number of factors, including the density of the air, the velocity between the object and the air, the viscosity and compressibility of the air, the size and shape of the body, and the body's inclination to the flow. In general, the dependence on body shape, inclination, air viscosity, and compressibility is very complex. One way to deal with complex dependencies is to characterize the dependence by a single variable. For drag, this variable is called the drag coefficient, designated CD. This allows us to collect all the effects, simple and complex, into a single equation. The drag equation states that drag force, FD, is equal to a drag coefficient, CD, times the density of the air, ![]() , times half of the square of the velocity, v, times the reference area, A.
, times half of the square of the velocity, v, times the reference area, A.
![]()
For given air conditions, shape, and inclination of the object, we have to determine a value for CD to determine the drag. Determining the value of the drag coefficient is difficult because of the multiple sources of drag. The drag coefficient given above includes form drag, skin friction drag, wave drag, and induced drag components. Drag coefficients are almost always determined experimentally using a wind tunnel.
Notice that the area in the drag equation is given as a reference area. The drag depends directly on the size of the body. Since we are dealing with aerodynamic forces, the dependence can be characterized by some area. But which area do we choose? If we think of drag as being caused by friction between the air and the body, a logical choice would be the total surface area of the body. If we think of drag as being a resistance to the flow, a more logical choice would be the frontal area of the body that is perpendicular to the flow direction. And finally, if we want to compare with the lift coefficient, we should use the same wing area used to derive the lift coefficient. Since the drag coefficient is usually determined experimentally by measuring drag and the area and then performing the division to produce the coefficient, we are free to use any area that can be easily measured. If we choose the wing area, rather than the cross-sectional area, the computed coefficient will have a different value. But the drag is the same, and the coefficients are related by the ratio of the areas. In practice, drag coefficients are reported based on a wide variety of object areas. In the report, the aerodynamicist must specify the area used; when using the data, the reader may have to convert the drag coefficient using the ratio of the areas.
With most bodies the drag coefficient tends to increase drastically at a Mach number of about 0.7. This is so because the body is encountering transonic flow phenomena, which means that at some place in the flow field supersonic flow is occurring. With a streamlined body the highest velocity in the flow field occurs at some point near the body and away from its nose. The local Mach number at this point will reach unity when the free-stream Mach number has a value of perhaps 0.7 or 0.8, thus a shock wave will form. Through the shock wave there is a sudden jump in pressure that causes an adverse pressure gradient in the boundary layer, resulting in separation and an increase in drag. The increased drag is caused not only by the separation effects; a substantial amount of energy is dissipated in the shock wave. Skin friction also contributes to the drag, and at Mach numbers above 2 or 3 heating in the boundary layer from skin friction may be an important phenomenon. As the Mach number increases beyond about 2, for most bodies there is a drop in the value of the drag coefficient because of a shift in the point of separation. In addition to the transonic and supersonic effects on drag, there is generally an increase in drag coefficient at low velocity (Mach <0.5) due to the occurrence of non-laminar (turbulent) flow.
Figure 3.2 shows the drag coefficients for some common shapes as a function of free-stream Mach number, M. For streamlining against subsonic flow, a rounded nose and a long, tapered afterbody generally result in minimum drag. In supersonic flow the best nose form is a sharp point, which tends to minimize the effect of the shock wave.
A fluid flowing past the surface of a body exerts a force on it. Lift is the component of this force that is perpendicular to the oncoming flow direction. It contrasts with the drag force, which is the component of the surface force parallel to the flow direction.
Lift is most commonly associated with the wing of a fixed-wing aircraft, although lift is also generated by lifting bodies. A lifting body is a fuselage with little or no conventional wing, in which the body itself produces lift. Even a simple space capsule, such as the Apollo command module, produces a significant and useful amount of lift. This lift is used to control the trajectory of the capsule, allowing reduced g-forces on the crew, as well as reducing the peak heat transfer into the capsule. While the common meaning of the word "lift" assumes that lift opposes weight, lift in the technical sense can be in any direction with respect to gravity, since it is defined with respect to the direction of flow rather than to the direction of gravity.
Lift depends on the density of the air, the velocity between the object and the air, the air's viscosity and compressibility, the surface area over which the air flows, the shape of the body, and the body's inclination to the flow. The dependence on body shape, inclination, air viscosity, and compressibility is very complex. These complex dependencies are dealt with by the introduction of a single variable, called the lift coefficient, designated CL. This allows us to collect all the effects into a single equation. The lift equation states that lift force, FL, is equal to a lift coefficient, CL, times the density of the air, ![]() , times half of the square of the velocity, v, times the reference area, A.
, times half of the square of the velocity, v, times the reference area, A.
![]()
For given air conditions, shape, and inclination of the object, we have to determine a value for CL to determine the lift. For some simple flow conditions and geometries and low inclinations, aerodynamicists can determine the value of CL mathematically. But, in general, this parameter is determined experimentally using a wind tunnel.
Lift-to-Drag Ratio
In aerodynamics, the lift-to-drag ratio, or L/D ratio, is the amount of lift generated by a wing or vehicle divided by the aerodynamic drag it creates by moving through the air. The term is calculated for any particular airspeed by measuring the lift generated, then dividing by the drag at that speed. These vary with speed, so the results are typically plotted on a graph. Because lift and drag are both aerodynamic forces, L/D ratio is an indication of the aerodynamic efficiency of the aircraft.
When the lift and drag coefficients are computed using the same reference area, the L/D ratio is,
![]()
The speed of sound, or acoustic velocity, is the distance traveled per unit time by a sound wave propagating through an elastic medium. In fluid dynamics, the speed of sound in a fluid medium (gas or liquid) is used as a relative measure for the speed of an object moving through the medium. The speed of an object divided by the speed of sound in the fluid is called the Mach number. The speed of sound, c, is given by the following equation.
![]()
where k is the specific heat ratio, R is the specific gas constant, and T is the air temperature in degrees Kelvin. For air on Earth, k is equal to 1.40 and R is equal to 287 N-m/kg-K. (In U.S. customary units, R = 1,715 ft-lb/slug-R, and T is in degrees Rankine).
Mach number, M is given by the equation,
![]()
As we have seen, the value of the drag and lift coefficients are strongly dependent on Mach number.
While the terms "subsonic" and "supersonic," in the purest sense, refer to speeds below and above the local speed of sound respectively, aerodynamicists often use the same terms to talk about particular ranges of Mach values. Flight can be roughly classified into the following seven categories:
| Regime | Subsonic | Transonic | Sonic | Supersonic | Hypersonic | High-hypersonic | Reentry speeds |
| Mach | <0.8 | 0.8-1.2 | 1.0 | 1.2-5 | 5-10 | 10-25 | >25 |
Table 3.1
Dynamic pressure, q, is the kinetic energy per unit volume of a fluid particle. It is defined by the equation,
![]()
An important aspect of dynamic pressure is that the aerodynamic stress, i.e. the stress within a structure subject to aerodynamic forces, experienced by an aircraft or missile is proportional to q. Therefore, by looking at the variation of q during flight, it is possible to determine how the stress will vary and, in particular, when it will reach its maximum value. The point of maximum aerodynamic load is often referred to as max Q and it is a critical parameter in many applications, such as during spacecraft launch.
It can be seen that dynamic pressure is part of the drag and lift equations. Substituting equation (3.6) into equations (3.1) and (3.2), we can rewrite the drag and lift equation in terms of q.
![]()
The ballistic coefficient, BC, of a body is a measure of its ability to overcome air resistance in flight. It is inversely proportional to the negative acceleration, that is, a high BC indicates a low negative acceleration. Ballistic coefficient is a function of mass, drag coefficient, and reference area (as used in the definition of CD).
![]()
From Newton's second law we see that dividing drag by mass gives the negative acceleration produced by the restraining drag force. From equations (3.1), (3.6) and (3.9), and dividing by m, we obtain
![]()
Ballistic coefficient has a significant effect on the flight behavior of satellites and reentry vehicles. We will examine this in more detail later.
Angle of attack, denoted by ![]() , is the term used to describe the angle between the chord line of an airfoil and the vector representing the relative motion between the airfoil and the oncoming air. In the case of a rocket, angle of attack is the angle between the longitudinal axis of the rocket and the direction of the air flowing past it. Angle of attack changes during flight as the vehicle changes direction and/or attitude.
, is the term used to describe the angle between the chord line of an airfoil and the vector representing the relative motion between the airfoil and the oncoming air. In the case of a rocket, angle of attack is the angle between the longitudinal axis of the rocket and the direction of the air flowing past it. Angle of attack changes during flight as the vehicle changes direction and/or attitude.
The drag and lift forces act through the body's center of pressure. The amount of force produced depends on the angle of attack. If the angle of attack is small, the drag and lift are comparatively small. Increasing the angle of attack increases lift up to a point; however, too high an angle of attack results in a loss of lift and can cause an aircraft to stall. The critical angle of attack is the angle of attack that produces maximum lift.
The variation in drag and lift forces that result from changing angle of attack are accounted for in the value of the drag and lift coefficients. Since CD and CL vary with angle of attack, their values are typically plotted on a graph.
Angle of attack generally refers the angle measured in the nose up/nose down direction (pitch). Angle of attack is usually defined to be positive when the relative wind is coming from below the nose of the aircraft. Sideslip angle, ![]() , is the angle between the body's reference line and the oncoming flow measured in the side-to-side direction (yaw). Sideslip angle is usually positive when the relative wind is coming from the right of the nose.
, is the angle between the body's reference line and the oncoming flow measured in the side-to-side direction (yaw). Sideslip angle is usually positive when the relative wind is coming from the right of the nose.
The center of pressure, CP, is the point on a body where the total sum of the aerodynamic pressure field acts. Mathematically it can be said that the net pressure force on the body acts through this point. In the same way that the weight of all the rocket components acts through the center of gravity, the aerodynamic forces act through the center of pressure. Typically the center of pressure is referenced to the nose of the vehicle.
There are several important problems to consider when determining the center of pressure for an object. As we change angle of attack, the pressure at every point on the object changes. And, therefore, the location of the center of pressure changes as well. In general, the pressure variation around the object also imparts a torque, or "twisting force", to the rocket. If an object is not restrained in some way it will rotate as it moves through the air.
To resolve some of these design problems, engineers prefer to characterize the forces on an object by the aerodynamic force coupled with an aerodynamic moment to account for the torque. It was found both experimentally and analytically that, if the aerodynamic force is applied at a location 1/4 of the length back from the leading edge on most low speed objects, the magnitude of the aerodynamic moment remains nearly constant with angle of attack. Engineers call the location where the aerodynamic moment remains constant the aerodynamic center. (For supersonic airfoils, the aerodynamic center is nearer the 1/2 chord location.) Using the aerodynamic center as the location where the aerodynamic force is applied eliminates the problem of the movement of the center of pressure with angle of attack in aerodynamic analysis.
When computing the stability of a rocket, we usually apply the aerodynamic forces at the aerodynamic center of airfoils and compute the center of pressure of the vehicle as an area-weighted average of the centers of the components.
For a rocket to be aerodynamically stable, the center of pressure must be located aft of the center of gravity. This ensures that any increased forces resulting from an increased angle of attack results in an increased restoring moment that drives the rocket back to the trimmed position. For small rockets using aerodynamics as the sole means of stabilization, the CP is typically one to two rocket diameters aft of the CG. Large launch vehicles, which operate part of the time outside the atmosphere, include additional means of stabilization, such as engine gimbaling and/or attitude control thrusters.
The center of pressure can be calculated but, in general, this is a complicated procedure requiring the use of calculus. The aerodynamic forces are the result of pressure variations around the surface of the rocket. In general, we must determine the integral of the pressure times the unit normal, times the area, times the distance from a reference line. Then divide by the integral of the pressure times the unit normal, times the area. This procedure involves much work and is too complex to demonstrate here. Simpler methods for locating the center of pressure have been developed that are quite satisfactory for small and model rockets.
Simple Method
A simple version of the calculation procedure can be used to compute the center of pressure of a model rocket. It is assumed that we already know the projected area and location, relative to some reference location, of each of the major parts of the rocket: nose, body tube, and fins. The approximate location of the rocket's center of pressure from the reference line is given by the following equation.
![]()
where AN, AB and AF are, respectively, the projected areas of the nose, body tube, and fins; and XN, XB and XF are the distances of each area's centroid from the reference line.
Barrowman Method
Another method for determining the center of pressure is that documented in 1967 by James S. Barrowman of NASA's Sounding Rocket Branch at Goddard Space Flight Center. This simple algebraic method is able to compute to high accuracy the center of pressure of a rocket flying subsonically at small angles of attack.
|
LN = length of nose
d = diameter at base of nose dF = diameter at front of transition dR = diameter at rear of transition LT = length of transition XP = distance from tip of nose to front of transition CR = fin root chord CT = fin tip chord S = fin semispan LF = length of fin mid-chord line R = radius of body at aft end XR = distance between fin root leading edge and fin tip leading edge parallel to body XB = distance from nose tip to fin root chord leading edge N = number of fins |
Nose
Conical Transition
Use for both increasing and decreasing diameters. For multiple transitions, calculate each separately using different XP.
Fins
For multiple sets of fins, calculate each set separately using different XB.
Location of CP
The total rocket force coefficient is the sum of the force coefficients of each part calculated,
![]()
The distance of the rocket CP from the nose tip is the sum of the products of the force coefficient and CP of each part divided by the total rocket CN,
![]()
Figure 3.4
|
Aerodynamic forces are used differently on a rocket than on an airplane. On an airplane, lift is used to overcome the weight of the aircraft, but on a rocket, thrust is used in opposition to weight. Because the center of pressure is not normally located at the center of gravity of the rocket, aerodynamic forces can cause the rocket to rotate in flight. The lift of a rocket is a side force used to stabilize and control the direction of flight. While most aircraft have a high lift to drag ratio, the drag of a rocket is usually much greater than the lift.
All forms of drag affect a rocket in flight, with each contributing to the drag coefficient. Skin friction drag is caused by friction between air molecules moving at different speeds in the boundary layer that surrounds the rocket. This effect is coupled to the overall surface area of the rocket. At subsonic speeds, skin friction is normally the largest contributor to overall drag, and even at supersonic speeds, it is a main contributor. Form drag, or pressure drag, is the drag caused by a rocket pushing aside the air in front of it. At subsonic speeds, pressure drag normally contributes only slightly to the overall drag. At supersonic speeds, pressure drag (then commonly called wave drag) can be significant, especially if the forward facing parts of a rocket are blunt. The base area of a rocket produces form drag caused by the wake trailing behind the rocket. During powered flight, base drag is significantly reduced at high altitude as the wake tends to get filled by the expanding exhaust from the engine. Interference drag is generated where two surfaces are intersected at an angle, causing the flow patterns to interfere with each other. For a rocket, this drag is generally caused by the interference of flow over the fins and that over the rocket body. Parasitic drag is caused by objects that are attached to the outside surface of the rocket. Lift-induced drag occurs when the rocket nose, body and fins are inclined to the flight direction.
Optimal design in terms of minimum drag depends heavily on the velocity in question. For rockets spending most of their flight at subsonic speeds, the nosecones should be rounded and they should have boattails. Similarly, the leading edges of the fins should be rounded and have sharp trailing edges. Maximum fin thickness should be closer to the leading edge than to the trailing edge. For rockets spending most of their time at supersonic speeds, it is essential that all forward facing surfaces, i.e. nosecone and leading edges, are sharp. Boattailing and sharp trailing edges are also desirable. The fins should be thin with maximum thickness midway between the leading and trailing edges. In general, the total surface area of any rocket should be kept as small as possible. Also, the cross-sectional area should be kept at its minimum practical value. When drag considerations contradict stability considerations, then stability conditions are of greater importance.
Lift occurs when a flow of gas is turned by a solid object. The flow is turned in one direction, and the lift is generated in the opposite direction, according to Newton's third law of action and reaction. For a rocket, the nose cone, body, and fins can turn the flow and become a source of lift if the rocket is inclined to the flight direction.
As shown in Figure 3.4, the drag and lift forces are defined in relation to the direction of the oncoming air. In some cases it would be convenient to consider the aerodynamic forces relative to the longitudinal axis of the rocket. For this purpose we define the forces FA and FN as shown in Figure 3.5, where FA is the axial force and FN is the normal force. The geometrical relation between these two sets of components are,
![]()
When the rocket is flying at zero angle of attack, drag force and axial force coincide, i.e. FD=FA, and FL=FN=0.
The axial force and the normal force can be defined using dimensionless coefficients CA and CN, where
At very small angles of attack we can approximate CN to be linear with ![]() , where CN,α is the normal force coefficient gradient, dCN/d
, where CN,α is the normal force coefficient gradient, dCN/d![]() , per degree.
, per degree.
![]()
Note that the normal force produces a turning moment, m, around the rocket's center of gravity. The magnitude of this moment is given by the equation,
![]()
where XCG and XCP are the distances of the CG and CP from a reference point, typically taken as the tip of the rocket's nose.
It is common to normalize moments by specifying a characteristic length, d, where the choice of d is commonly the diameter of the rocket. We define m, called the pitch moment, as follows
![]()
where Cm is the pitch moment coefficient. Note that, Cm/CN = (XCG-XCP)/d.
Force Coefficients
Mathematical methods exist for the computation of a rocket's drag coefficient. These methods typically involve computing the contribution to the drag coefficient from all parts of the rocket and from all types of drag, and then taking a mathematical sum of the individual contributions to obtain the total drag coefficient. Generally speaking, these methods are lengthier than we wish to present in the web page. However, if the reader wishes to study these techniques from the original source documents, we refer you to the following:
Be aware that the documents above use U.S. customary units. Furthermore, the letters and symbols used to represent common variables may be different than those found in this web site. It is up to the reader to sort out these differences and make sense of the information and methods presented.
Case Study #1 – Apollo/Saturn V
Published data on the drag coefficients of large commercial launch vehicles is usually difficult to find. One exception is the Saturn V launch vehicle used in the 1960s and '70s. One of the most complete technical documents addressing the aerodynamic characteristics of the Saturn V is the following.
The document presents experimental static aerodynamic data for six configurations of the Apollo/Saturn V launch vehicle. Wind tunnel tests were conducted at six different facilities on three different scale models of the Saturn V. Figures 3.6 and 3.7 are a couple of the more interesting and useful graphs. The reference area is that of a cross-section cut through the Saturn V's main body, where the reference diameter Dref = 10.06 meters (33 feet)
Figure 3.6 — Variation of Normal Force Coefficient Gradient and Center of Pressure with Mach Number.
Figure 3.7 — Variation of Axial Force Coefficient with Mach Number.
Note that Figure 3.7 breaks the total axial force coefficient CA,T into two components, base axial force coefficient CA,b and forebody axial force coefficient CA,f. Base axial force consists of the axial drag caused by the wake trailing behind the rocket. Forebody axial force consists of all forms and sources of axial drag acting on the rocket's forebody, i.e. the entire rocket body forward of its base. The coefficient of base axial force shown in Figure 3.7 is the value obtained during static wind tunnel tests. Under actual flight conditions, however, the base axial force is derived quite differently. To understand this we must look at another report.
You are specifically directed to Section 20, which reports on the aerodynamic characteristics of the Apollo 8 (AS-503) launch vehicle, as well as Apollo 4 (AS-501) and Apollo 6 (AS-502).
As before, total axial force is split into two parts: forebody axial force and base axial force. As explained previously, forebody axial force is calculated from the forebody axial force coefficient. Base axial force, however, is calculated from the average base differential pressure, as shown in Figure 3-8 below. The total aerodynamic axial force is then the sum of the forebody axial force and the base axial force. Note that forebody axial force coefficient varies with Mach number, and base differential pressure varies with altitude.
Figure 3.8 — Average Base Differential Pressure.
Because forebody axial force and base axial force vary with different parameters (Mach number and altitude respectively), computing them separately makes good sense because it provides an effective way to deal with variations in trajectory and atmospheric conditions. However, for a launch vehicle flying a normal ascent, it might be convenient to sum the aerodynamic forces and compute a total effective drag coefficient. Using NASA's Apollo/Saturn V postflight trajectory reports (such as this one), mean atmospheric conditions for 30° latitude, and the graphs provided in Figures 3.6, 3.7 and 3.8, we've been able to reconstruct the Saturn V's drag coefficient. Figure 3.9 does not represent any particular mission, but should be a close approximation of the drag coefficient for a typical Apollo/Saturn V launch vehicle flying a nominal trajectory.
Figure 3.9
Case Study #2 – Mercury/Atlas
Another example that we can refer to is a NASA trajectory simulation that was performed in advance of John Glenn's 1962 Mercury-Atlas 6 mission.
From the values of drag force and dynamic pressure given in Appendix B - Trajectory Simulation, we can calculate the drag coefficient using equation 3.7. The reference area is that of a cross-section cut through the Atlas' main body, where Dref = 3.05 meters (10 feet). Figure 3.10 below shows the variation of drag coefficient with Mach number for the Mercury-Atlas launch vehicle.
Figure 3.10
"Ballpark" CD
Drag is a significant force in rocket flight and must be considered in even the most basic flight analysis and simulation. However, unless the data is available to accurately determine a launch vehicle's drag coefficient, it is often not productive to spend considerable effort trying to compute it, or guess at it. For most medium to large expendable launch vehicles on nominal trajectories, the velocity losses due to drag are about 50 to 150 m/s. Therefore, an error of 10% in the drag coefficient might result in an error of only 10 m/s in the estimate of the total Δv required to attain orbit. Unless high precision is needed, this is often close enough.
Drag coefficients for launch vehicles are rarely published. It is helpful, therefore, to have a typical value that can be used as a "ballpark" in the absence of more complete data. In the case studies above we have derived drag coefficient curves for two similar and commonly shaped launch vehicles. Averaging the curves should provide us with a typical drag coefficient that we can use in cases when the real drag coefficient is unknown. Figure 3.11 is the approximate average of the two case studies. The curve is defined by the set of equations listed below the graph. The reference area is the zero angle of attack cross section through the main body of the launch vehicle. This area should include both core stages and strap-on boosters, but should exclude engine fairings, fins, and other protuberances. The drag coefficient incorporates the effect produced by the small non-zero angle of attack typical in a normal ascent.
Although lift is used to help stabilize a rocket and control its attitude, it has minimal effect on a rocket's position relative to time. For basic flight analysis and simulation, in which we want a general determination of a rocket's trajectory and payload capacity, lift can usually be ignored.
Figure 3.11
| M ≤ 0.6 | 0.2083333 M2 – 0.25 M + 0.46 |
| 0.6 < M ≤ 0.8 | 1.25 M3 – 2.125 M2 + 1.2 M + 0.16 |
| 0.8 < M ≤ 0.95 | 10.37037 M3 – 22.88889 M2 + 16.91111 M – 3.78963 |
| 0.95 < M ≤ 1.05 | – 30 M3 + 88.5 M2 – 85.425 M + 27.51375 |
| 1.05 < M ≤ 1.15 | – 20 M3 + 60 M2 – 58.65 M + 19.245 |
| 1.15 < M ≤ 1.3 | 11.85185 M3 – 44.88889 M2 + 56.22222 M – 22.58519 |
| 1.3 < M ≤ 2 | – 0.04373178 M3 + 0.3236152 M2 – 1.019679 M + 1.554752 |
| 2 < M ≤ 3.25 | 0.01024 M3 – 0.00864 M2 – 0.33832 M + 1.08928 |
| 3.25< M ≤ 4.5 | – 0.01408 M3 + 0.19168 M2 – 0.86976 M + 1.53544 |
| M > 4.5 | 0.22 |
Compiled, edited and written in part by Robert A. Braeunig, 2020.
Bibliography